The Rise of AI Observability: Why Monitoring Models Is Becoming Its Own Discipline
A model can pass every pre-production evaluation with flying colours and still silently degrade in production within weeks. Prompts drift as users find new ways to phrase requests. LLM providers quietly update the checkpoint behind an API without changing the model name. Costs compound at a rate that surprises nearly every team that isn't tracking token spend at the individual request level. None of this shows up as an error. It shows up as a slow, invisible decline in quality that nobody notices until a customer complains, or a compliance auditor asks a question nobody can answer.
This is the gap AI observability exists to close — and in 2026 it has become a distinct engineering discipline in its own right, not a feature bolted onto existing infrastructure monitoring. This article explains what AI observability actually means, why traditional monitoring falls short, the tooling landscape as it stands today, and what building an observability practice honestly requires. It is a direct technical companion to our MLOps guide — this is the production monitoring layer that guide argues every serious ML deployment needs, examined in full.
Why "We Already Have Datadog" Is Not the Answer
Provider dashboards from OpenAI, Anthropic, or Google show aggregate token usage and cost. They do not show per-user or per-feature cost breakdown, quality scores, drift metrics, correlation between prompt versions and output quality, or custom alert rules — they are a starting point, not a monitoring strategy. Traditional APM tools tell a similar story: platforms built for infrastructure metrics are adding LLM tabs that track tokens and latency alongside CPU and memory, but latency and token count answer whether the system ran, not whether it produced a good answer. A request that returns in 400ms with a hallucinated fact looks identical, on a traditional dashboard, to a request that returns in 400ms with a correct one.
This is the distinction that defines the category in 2026: traces enable observability; evaluation enables knowing whether the system actually works. You need both, and most teams only have the first.
The Three Pillars of AI Observability
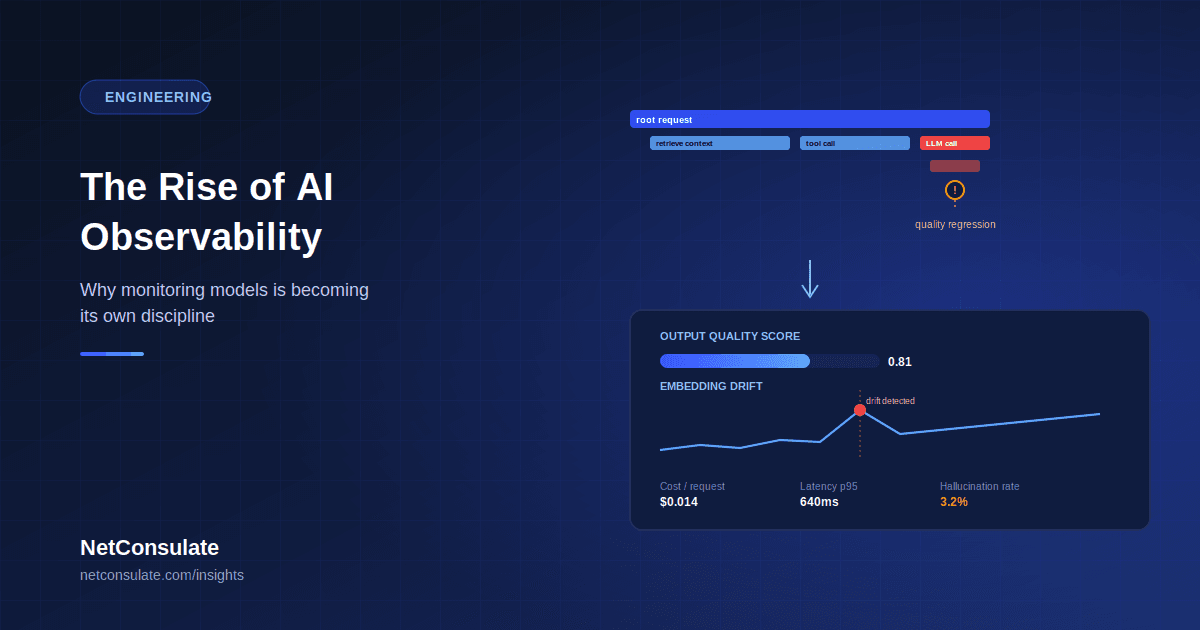
1. Tracing — what actually happened, step by stepFor a single LLM call, a trace captures the prompt, the retrieved context (in a RAG system), the model's response, token counts, and latency. For an agent — where one model call triggers another, which calls a tool, which triggers a further reasoning step — tracing becomes distributed tracing: each agent hop creates a child span that inherits the root trace ID, allowing the full chain to be reconstructed for any single request. Without this, debugging a multi-step agent failure means guessing which of ten steps caused a hallucination or a latency spike, rather than seeing it directly — precisely the debugging problem covered from the architecture side in our autonomous agents guide.
2. Evaluation — scoring whether the output was actually goodThis is where observability tooling in 2026 has matured the most, and where it separates itself from simple logging. Modern platforms score outputs for faithfulness, correctness, and hallucination in real time, typically using either a larger "LLM-as-judge" model or a smaller, purpose-built scoring model to keep evaluation cost and latency manageable at scale. The practical pattern: let the user interaction complete instantly, then run a background scoring process against the interaction — quality assessment doesn't need to block the response, but it does need to happen on every request, not a sample reviewed manually once a week.
3. Drift detection — catching degradation at the sourceDrift comes in more than one form, and conflating them leads to missed signals: data drift (the distribution of incoming prompts shifts), concept drift (the real-world meaning of a correct answer changes), and embedding drift (semantic clusters of user intent shift over time, often detected by measuring distance between embedding centroids across time windows). A genuinely useful example of what this catches in practice: if users suddenly start asking about a competitor's product the model was never trained to discuss, embedding-based drift detection surfaces that as a new semantic cluster almost immediately — long before a support team would notice the pattern manually.
The Tooling Landscape — Three Camps, and Where the Real Value Sits
The market has split into three distinct categories, and it's worth understanding which problem each one actually solves before choosing:
AI-native tracing and evaluation platforms — Langfuse (open-source, self-hosted, MIT licence), LangSmith (built by the LangChain team, considered a strong standard for debugging complex agentic loops), Arize Phoenix and Arize AI (embedding-based drift detection with 3D cluster visualisation), Galileo (purpose-built small "judge" models running at sub-200ms latency for real-time scoring), Fiddler (enterprise-focused, strong on explainability and compliance for regulated industries), and Opik by Comet. These go deepest on the combination of tracing and quality evaluation specifically for LLM and agent workloads. AI gateways — Helicone and Portkey sit between an application and its LLM provider, adding routing, caching, fallback handling, and cost tracking with minimal code changes. Portkey's lightweight footprint (roughly 122KB) adds sub-millisecond overhead while handling failover and load balancing logic that would otherwise require significant custom engineering. Observability here is a built-in feature of the gateway, not the primary focus — teams get request-level logging and cost tracking as a byproduct of solving a different problem (reliable routing), and the evaluation layer tends to be thin. Traditional APM extended into AI — Datadog LLM Observability and similar platforms add LLM and agent tracing to existing infrastructure monitoring, including features like trace cluster maps that group traffic into semantic topic clusters. The advantage is unifying AI observability with infrastructure observability your team already monitors; the trade-off is generally shallower AI-specific evaluation depth than the purpose-built platforms.No single category is universally correct — the right choice depends on whether your priority is deep quality evaluation, reliable multi-provider routing, or unifying AI metrics with existing infrastructure dashboards you already depend on.
Beyond Passive Monitoring — Runtime Intervention
The most significant architectural shift in 2026 is platforms moving from reporting degradation to acting on it. Some platforms now support runtime intervention that acts on detected drift within roughly 250 milliseconds — preventing a degraded output from ever reaching a user, rather than flagging it after the fact for a human to review. This closes the loop between detection and correction, and it connects directly to the guardrail discipline covered in our autonomous agents guide: action-level controls and confidence thresholds are most valuable when they can act in real time, not only in a weekly quality report.
The Emerging Standard Worth Knowing About: OpenTelemetry GenAI
A meaningful maturation signal for the category: the OpenTelemetry GenAI Special Interest Group is actively developing semantic conventions specifically for AI and multi-agent systems — standardised ways of representing tasks, actions, agent teams, and memory within the existing OpenTelemetry tracing standard already widely adopted across software engineering. For teams already invested in OpenTelemetry for general infrastructure tracing, this means AI observability is becoming something that plugs into existing tooling and conventions, rather than requiring an entirely separate, disconnected monitoring stack — a meaningful reduction in the operational overhead of adding AI observability on top of systems that already have mature monitoring practices.
What Production-Grade AI Observability Actually Requires
Cost tracking at the span level, not just monthly totals. Token costs compound in ways that surprise teams who only check a monthly provider invoice. Tracking cost per user, per feature, and per individual request is what turns "our AI bill went up" into "this specific feature's prompt got 40% longer after last week's change" — an actionable finding instead of a vague concern, and directly relevant to the model-routing economics covered in our small language models and real-cost-of-AI-projects guides. An evaluation framework with a real scoring rubric. Drift detection framed as "score drift plus slice analysis" — tracking how quality scores change across defined user segments and prompt versions — requires an actual scoring framework to exist before drift can be measured against it. Teams without a clear rubric for what "good" looks like cannot meaningfully detect when outputs stop being good. Distributed tracing designed in from the start for agentic systems. Retrofitting trace correlation onto an agent system already in production is materially harder than designing parent-child span relationships in from the first architecture decision — this is an area where the MLOps discipline of building observability alongside the system, not after it, pays back directly. Alert routing matched to actual severity, not a single undifferentiated notification channel — critical quality regressions routed to immediate paging, lower-severity drift signals routed to a review queue, so the team isn't trained to ignore alerts through sheer volume. A closed loop back into development. The most effective observability setups curate production traces automatically into evaluation datasets for the next testing cycle — meaning real production failures directly improve the test suite that catches the next regression before it ships, rather than every incident being handled as an isolated one-off.A Readiness Checklist
- Evaluation scoring framework defined explicitly — what does "good output" mean for your specific application, measurably
- Drift detection distinguishing data, concept, and embedding drift rather than treating "drift" as one undifferentiated signal
- Cost tracking implemented at the span/request level, not only aggregate monthly totals
- Distributed tracing designed for multi-agent or multi-step workflows before they reach production, not retrofitted afterward
- Alert severity tiers defined, with critical regressions routed differently from routine drift signals
- A decision made between AI-native platforms, gateway-based observability, and APM extension, based on your actual priority — evaluation depth, routing reliability, or infrastructure unification
- A feedback loop established so production traces genuinely inform the next evaluation and test cycle
Conclusion
AI observability has moved from an afterthought to a discipline with its own tooling category, its own emerging standards, and its own genuine engineering depth — because the alternative, discovering quality degradation from a customer complaint or a compliance incident, is no longer an acceptable operating model for any AI system making decisions that matter. The teams getting this right treat evaluation, drift detection, and cost tracking as core production infrastructure built in from day one, using the same MLOps discipline that governs model training and deployment, extended into what happens after a model ships.
If your organisation is running AI systems in production without a real observability practice — or has one that only tells you the system responded, not whether it responded well — NetConsulate designs monitoring, evaluation, and drift detection infrastructure that closes the loop between production behaviour and continuous model improvement.
Running AI in production without full visibility into output quality? Submit a proposal request and our team will respond with a tailored observability approach within 2 business days.